Caron Butler was my way in.
It was 2008. I had been volunteering for Dean Oliver, then the Director of Quantitative Analysis for the Denver Nuggets, for most of the last year, and Dean had invited me up to the MIT Sloan Sports Analytics Conference. Dean had a friend with another team that was looking to hire a statistical analyst who he said I should meet, and so I flew up to Boston, thinking this could be my big break into the industry.
It wasn’t. The meeting fell through — the person I was supposed to meet with had a last minute change of plans and went on a scouting trip instead. When I arrived to find out the news, it was certainly a let down, but all was not lost. Another opportunity would soon appear.
There was a little hangout after the panels that many of the attendees and participants hung around for. I’m still not one to just go up to strangers and start talking, and that certainly wasn’t my forte at the time as a sophomore in college, but I knew this was a chance I couldn’t get otherwise. I saw John Hollinger across the room and decided I would approach and ask him a question. But what question?
And that’s when Caron Butler popped into my head. Butler played for my hometown Washington Wizards, and had recently seen a big improvement in performance — one he had attributed to going cold turkey to end his Mountain Dew addiction. I wondered: how did John think about Caron’s sudden improvement, and how to predict these kinds of changes statistically?
I took a deep breath, headed over, tapped him on the shoulder, and asked my question. For anyone that knows John, you know how this story ends: he was warm and friendly and talkative and was happy to engage in a long discussion about the subject. We talked for a while, flowing from topic to topic, others joining in, forming a conversation circle.
At one point, Rick Carlisle walked by. Carlisle had been working for ESPN after leaving the Pacers the previous season. (He’d be hired by Dallas a few months later.) John had a question for him, so he grabbed Rick’s arm as he passed. And, much to my delight, Rick joined the circle and participated in the conversation.
That’s how I found myself standing next to Rick Carlisle, picking his brain on topics such as how he thought about how many minutes to give players he had coached like Corliss Williamson and Jeff Foster who were really good in their playing time but didn’t see the court much. The conversation continued, and after a few minutes Rick turned to me: “You’re one of those numbers guys, aren’t you?”
“What do you mean?” I asked.
“Well like you’re really good with basketball stats. You seem like that kind of guy.”
“I guess,” I mumbled, not really sure what to say.
“How would you like to do my stats for me for ESPN?”
My eyes widened and heart leapt. I choked out some response that luckily Rick understood as a “yes”.
“Great, then write down your contact information for me and I’ll be in touch.”
I hastily scribbled down my email address. I had been looking for a break, and now here it was, appearing in the most unlikely way. The rest of the day I was floating, giddy with excitement.
I never heard from Rick. I figured he lost the piece of paper with my info on it, and with no way to reach out to him I resigned myself to having let this opportunity slip through my grasp. And that’s how I learned my first Sloan Conference lesson: get their contact information too.1
As it happened, losing that opportunity wasn’t the end of my NBA aspirations. The next year I attended the conference as a member of the Portland Trail Blazers’ front office. Blazers’ GM Kevin Pritchard, Director of NBA Scouting Mike Born, and I headed over to the MIT campus on a cold March morning, sitting in lecture halls to watch the various panels.
The current conference barely resembles that one. Since that point, ESPN has become a sponsor, the conference has moved to various, larger convention centers in Boston, and each year seems to be bigger and more impressive than the last. (Although I’m not sure how they’re going to top Obama’s appearance.)
This year was my 11th straight Sloan Conference appearance, and there are a few things I’ve learned through the years. The panels are best viewed as a way to get the gears turning: they are thought-provoking and useful to spark ideas, but you’re not going to learn a whole lot from them. Most of the people on stage can’t speak freely — it’s too public of a forum. They don’t want to say anything that might get them in trouble or give competitors a leg up.
The real value is in the hallways: meeting and catching up with those around the industry. They still have to be guarded, but can talk about much more interesting topics or questions than if their words were going to be broadcast on social media. And once I was working for teams, I found that we could help each other, debating provocative questions, discussing how to overcome similar challenges, and swapping insider stories. This is particularly true across sports, where there is even less reason to be guarded.2
The networking can also be incredibly important in career advancement. NBA scouts and coaches have typically been able to meet each other at various league events: scouting events, summer league, the draft combine, summer coaching camps. They form relationships that can then inform hiring decisions as they get promoted. But nothing like that existed for those in the analytics department. Until Sloan.
For those who aren’t in the league yet, Sloan can also serve as a way to put a face to a name. To those hoping to use the conference as a way to get a job, I’d caution against relying on it too much: teams get approached by so many job hunters handing out resumes and business cards that simply attending the conference won’t separate you from the pack. But if you’ve followed my other recommendations in “How to Get a Job in the NBA”, going to Sloan can be a final piece of the puzzle as a convenient place to meet those who you have contacted or to show off your work in person.
For all of these reasons, the Sloan Conference has played a pivotal role in the rise of sports analytics. It creates buzz. It gives a bullhorn to those who look at sports through an analytical and technological lens. It fosters connections among those in the industry.
But it’s not necessarily a conference geared around learning. Despite the presence of research papers and posters, Sloan is not about growing the field in an academic sense. The best place to learn at Sloan is at the paper presentations, but that’s more about the rest of the conference than it is about the papers themselves.
Because, in my experience, it’s important to be very skeptical when reading the papers or listening to the presented results. I don’t mean skeptical in an insulting way, but rather in the way that science is built around: asking questions, examining hypotheses, challenging conclusions, trying to reproduce work.
But that process is made more difficult by the fact that most of the papers use proprietary data sets and don’t post their code. Michael Lopez, a statistics professor at Skidmore, has been vocal about this aspect of the conference:
Lit reviews have never been a strength of Sloan papers. Sadly, contest incentives only encourage exaggerated claims and ignorance of related approaches
— Michael Lopez (@StatsbyLopez) February 17, 2018
Lopez noted last year that:
Of this year’s 21 listed finalists, less than half cite publicly available data that could be used by outsiders, as most submissions use proprietary data or do not give sufficient detail behind how the data was gathered. Even among those obtaining public data, however, only two are accessible without writing one’s own computer program or doing extensive searching. At best, five or six papers boast any chance of being replicable, which, sadly, is only a few more than the number of papers that don’t share any information about where their data came from.
That story wasn’t changed this year, according to Stephanie Kovalchik, who noted that only three of the 20 papers used publicly available data.
That makes scientific skepticism difficult, and creates a real challenge around taking anything meaningful from this research. As an example, we can look at the “High resolution shot capture” paper. The author, Rachel Marty, shared some of her code, which is a great step and should be applauded. But the data she worked with was a proprietary data set from Noahlytics.
That means we can’t verify the conclusions ourselves, and are left to parse whatever is revealed in the paper. This can be a problem if the methodology isn’t described in enough detail. One conclusion from this shooting paper was that corner threes are aimed too far to one side, that shooters are potentially overcompensating for trying not to hit the backboard. That’s a reasonable and interesting conclusion, but one we’d just have to accept and not be able to examine further because nobody else has access to the data set.
Luckily the paper includes a shot chart that shows where the conclusion comes from:
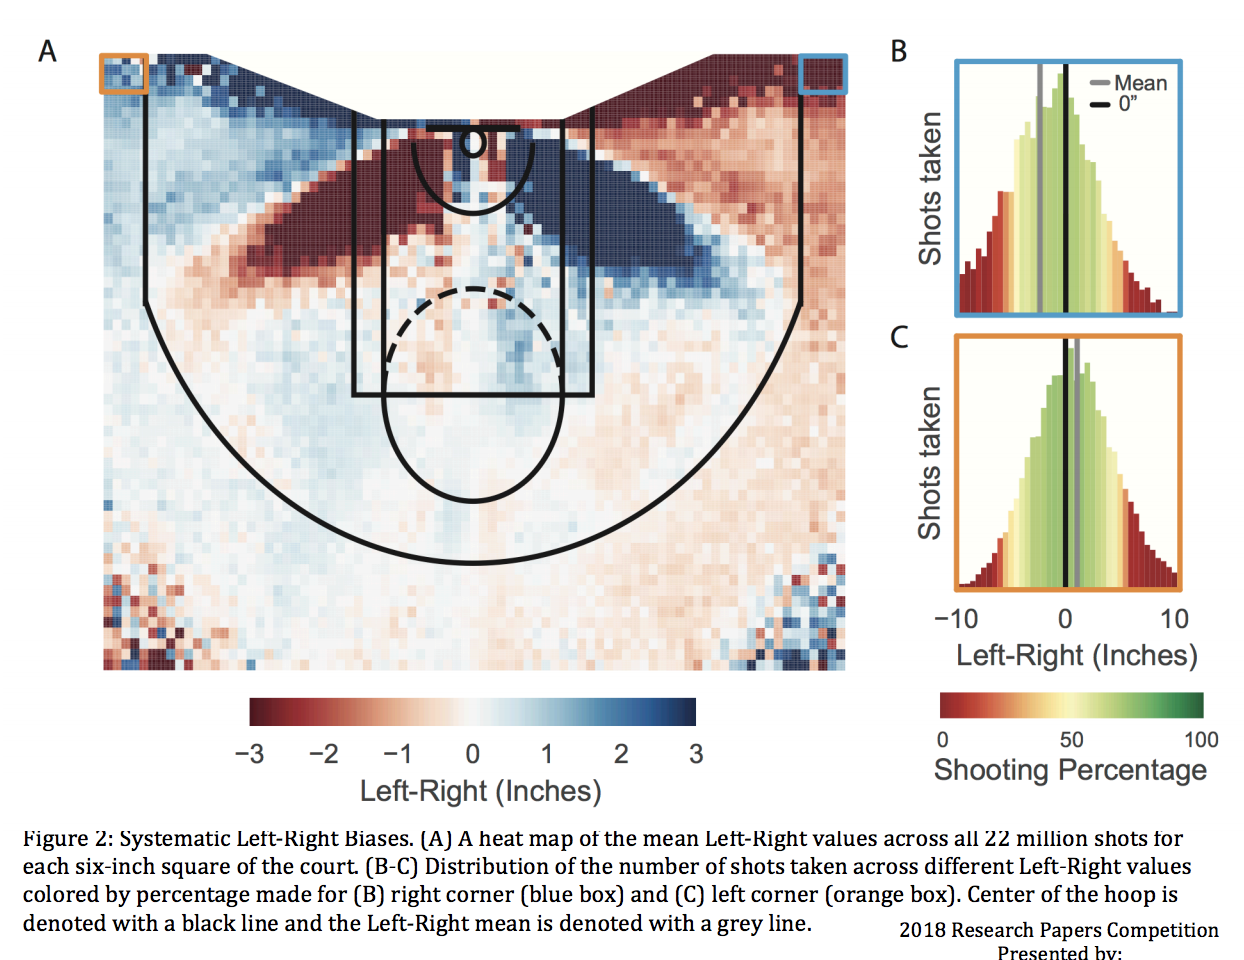
We can see here, if this graphic accurately represents the underlying data, that what is referred to as a “baseline” three is actually behind the backboard. This changes our analysis of the results: it’s not about the typical corner three point shot being aimed wrong, but just about those extreme corner shots.
But imagine if this specific graphic wasn’t included — we wouldn’t be able to answer that question. Nothing in the text of the paper says precisely which shots are labeled as “baseline” threes. We’d just be forced to either accept the results or not. This is the antithesis of the way scientific research is supposed to work. We believe in the conclusions of research not because we are taking an expert’s word for it, but because their research is public and replicable, and we can independently verify it.3
This issue with Sloan papers is emblematic of a central tension in the sports analytics world: the slow death of public analysis. The APBRmetrics listserv/message board is a great example of this. That online community was how I got my start in the field. As I wrote in “How to Get a Job in the NBA”:
I stumbled upon a basketball statistics mailing list. But this wasn’t just a random group of fans — this was the APBRmetrics mailing list, where the leaders of the emerging field of basketball analytics participated. Dean Oliver. John Hollinger. Kevin Pelton. Roland Beech. The pioneers of the field, discussing their thoughts in the open.
I read everything I could, and then began to ask questions. Eventually, as I gained more knowledge and confidence and data, I started to participate. By the time I was a freshman in college, I was able to do real analysis with the data I had collected. And that was when I got my break.
The board provided a place to present research, read others’, get good feedback, and share data. But it has experienced a long decline, for the same reason that public analysis in general has: the work has become too valuable.
Almost anyone doing good public analysis gets hired by teams or vendors. Meanwhile, the data companies know teams and media companies will pay for that data, and so the data is so expensive that nobody outside of a big company can afford it. And no company (the leagues included) wants to make the data public because that would undercut their ability to sell to others.
I don’t begrudge them this. That’s just business. And it’s not like this is drug research or an area where the information kept under lock and key could really be helping people in a tangible way.
But there is a cost to this. For one, sports has served as an entry point to data analysis for many. Sports is interesting and has great data relative to other fields, so it can teach skills and methods of thought that are then more broadly applicable. Personally, I learned how to program, a skill that has been enormously valuable to me, specifically to analyze basketball stats. And I’m far from the only story like this.
Yet the more the public conversation falls behind what is viewed as cutting edge, the less interested fans will be in acquiring these skills to do their own analysis. Why do the work if you know it won’t be treated as valuable by those inside the industry?
Similarly, sports data can serve as a great sandbox to learn techniques and methodologies that can then be applied to more meaningful endeavors. Coordinate data is now taking over the sports world, and a good bet is that this method of analysis will soon make its way to plenty of other places that can be useful in industry and government. Right now only a handful of people have expertise in dealing with this kind of data. But if sports coordinate data was publicly available and easy to work with by fans, you might end up with many many more that are proficient in this type of analysis.
Lastly, there is a lot of wasted work happening. Teams and companies are working within their own little silos, all doing largely similar work. Some of this is necessary — these are competitive enterprises, so of course they are trying to do similar things slightly better than others — but the question is how much of this work should be done separately and how much shared. It would be silly if teams all had to invest in ways to record video of each game, for example, instead of the league centralizing this and letting them download the games as needed (as they do). Is something similar going on with statistical analysis?
I think we’re largely unaware of just how much debt we owe to the public methods of basketball analysis that developed before all of those practitioners were hired. Established methods and metrics like per possession stats, effective field goal percentage, true shooting, the Four Factors, rebounding percentages, and more, have served as a foundation for basketball analysis everywhere. But imagine if they never reached the light of day because those who developed these methods were working for teams at the time? Everyone would have been left to reinvent the wheel, and our basketball conversation would be much poorer for it.
This same foundation doesn’t exist for the new coordinate data, because the work is being done in private. I give credit to the NBA for investing in their stats site and releasing some summary stats from the coordinate data, but many of these stats have the same problems as the papers mentioned before: it is not clear how they are generated, whether they are correct, or whether they tell us anything meaningful about team and player performance. And there are whole universes that have opened up with this data that aren’t close to being available to the vast majority of fans or reporters.
Even teams don’t have the luxury of examining everything that is available. The size of the analytics departments within teams is not commensurate with the amount of data that is now being produced. Either teams will have to massively scale up their manpower or let these fields of study lie fallow. Both the public and private conversation is impoverished by this current state of affairs.
This is not a problem unique to information-based disciplines, but it is most apparent in them. We’re not talking about how to share money or food or tickets to a game, goods that can only be consumed by one person, that are impossible for two people to use simultaneously. Information can be consumed by multiple people at once, and that means we have to think about it differently.
Thomas Jefferson described this phenomenon by comparing it to lighting one candle with another: “He who receives an idea from me, receives instruction himself without lessening mine; as he who lights his taper at mine, receives light without darkening me.”
This tension isn’t new. It was written about by Slate at the Sloan Conference five years ago. But it’s growing bigger every year. There’s a balance here, and it’s not clear we’re striking it correctly.
How can we bridge the gap between the competitive needs of teams, the large dollar values placed on data from these providers, and the desire for all of us to learn from the data and do research that everyone could benefit from? How can we spread the light?
That might start with maybe the most central question: what is the responsibility of and in the best interest of the league itself? The NBA ultimately has control over this and has been progressive on this front, but may not fully realize the benefit it has reaped through the statistical revolution — a revolution made possible by having publicly available play-by-play data. Will it pay a cost for not doing something similar with the coordinate data?
Michael Lopez has a few suggestions. A small one is for the Sloan Conference to feature tracks for both private and public (open data, open code) research to incentivize more public research. A larger suggestion is for the companies and leagues themselves to release sample data sets to allow for meaningful research without undercutting the value of the full dataset to teams and media partners.
STATS has actually done something like this. Researchers can apply for specific data sets on their website, giving some opportunity to researchers without hurting the company itself. As Patrick Lucey, the Director of Data Science at STATS, noted in response to this exact question last year:
There has to be a balance, because you have to consider that data collection and validation time are very consuming. You know, we spend 99 percent of our time just collecting and cleaning up data. There has to be some type of benefit for collecting that and sharing that idea and having that first-mover advantage. I think people would realize that. So we have to be thought leaders; we have to share data. We’re starting to do that, and it’s something we’re very mindful of…”
I’d love to see STATS go even further with this, and other companies (including the NBA itself) follow their lead. One possibility is to learn from the open source software movement, which has standard licenses that often create blanket prohibitions on using licensed code for commercial purposes but allow for discussion and community growth for its own sake. There is much to be gained by fostering this community, even if it’s not immediately apparent.
Now, you might be saying: wait, the guy who charges money for his stats and writing is calling for more open information? Fair point. Again, I acknowledge the need for businesses to make money, just like I’m using this site to make a living. I have seen this from both perspectives.
But I’ll put myself out front and practice what I preach: if you’d like to work with some of my data for non-commercial purposes and have the technical skills to do so, email me (ben@cleaningtheglass.com) and we’ll see if we can work something out. I may not be able to manage all of the requests by myself, so this may have to wait until a point where I’m able to actually serve everyone, but I figure I’ll open the doors and see what happens.
Because, as someone who owes my career to the growth of this industry, I can see its power. I have been enormously fortunate to be part of this incredibly rapid upswing, one the Sloan Conference has sat at the center of.
What the conference has been, and what it has turned into, is astounding. I couldn’t have imagined, sitting in that lecture hall 11 years ago, that the conference would become almost mandatory attendance for the who’s who of the sports industry — and that it would include a panel with the former President of the United States himself.
But it’s important to understand what the conference is and what it is not. It’s a place to meet John Hollinger and Rick Carlisle, to get inspired, to see the evolution of a movement. It’s not an academic conference, it’s an industry conference. And as such, it shines a light on one of the big tensions within sports analytics, one that will only increase in intensity.
- Years later, as VP of Basketball Strategy with the Sixers, I ran into Rick again. I asked him if he remembered me from that conference years ago. I looked pretty different, but without missing a beat he said: “Of course I do. Do you remember what I said on my panel about how to improve the game?” And he proceeded to tell me exactly what he had said 7 years prior. ↩
- In general, I don’t think we do enough cross-sport learning: the challenges are similar, and other sports often have equally valid but different approaches simply by virtue of how their analysis has evolved. For example, Will Spearman’s presentation of his paper “Beyond Expected Goals” got me thinking about basketball coordinate data through a different paradigm. ↩
- To be clear, I am not picking on this specific paper, but using it as an example of problems that occur in almost all of these papers. ↩