
Player: On/Off Stats
The Player On/Off section shows all of CTG's team stats broken down by whether the player is on the court, off the court, or what position they're playing. The default view shows you only the off-court stats, but on-court and position stats can be seen by using the links above any table). It's a complicated page, but a very powerful one, since over time you can pick up trends in how a team tends to perform with a player in the game vs. out of it.
This guide tells you how to think about these tables using the first table, Team Efficiency and Four Factors, as an example. For specific explanations of each stat in any of the tables, please see the appropriate guide:
- Efficiency and Four Factors
- Shooting Frequency or Accuracy
- Context Stats: Halfcourt and Putbacks or Transition
Off Courtclick to show/hide
What we're interested in when looking at off-court stats is the difference in how the team performed with the player on the court compared to off. So, to make it easier to interpret, these stats are shown relative to what the on-court stats show: a +5.2 in the Offense Pts/Poss column, for example, means that the team scored 5.2 points per 100 possessions more with the player on the court than when they were off. That's good - it means the team was better on offense when the player was on the court. The percentile shown is based on this difference. So a 90 for an off court stat means that 90% of players had a worse on/off court differential in this category.
For example, in the Efficiency and Four Factors table, the expected wins (Exp W) stat will tell us the difference in expected wins with a player on vs. off the court. Let's say a player has a 45 for on court expected wins and a +10 for off court. That means when the player was on the court his team played at the level of a 45 win team, and when he was off the court they played like a 35 win team.
Example: Nikola Jokic
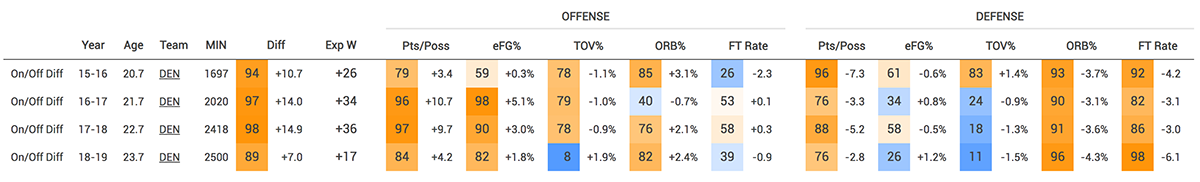
Nikola Jokic's star status can be easily seen from his on/off differentials. In every year of his career, the Nuggets have been far better with Jokic in the game than with him on the bench. That improvement has not only been true on offense, where he's recognized as a great player, but on defense, where he's commonly thought of as a poor player.
This table gives us insight into why the team has been so much better with Jokic in the game. On offense, the Nuggets have consistently shot much better. Until 2018-19, they had also taken better care of the ball. In three of these four seasons they've offensive rebounded much better with Jokic in the game. Their scoring from the free throw line, on the other hand, doesn't seem to change much with Jokic playing or on the bench.
The defensive side of the ball tells a clear story. The Nuggets have been far better on the defensive glass with Jokic playing, and have sent opponents to the free throw line far less. That jumps out at you from all the dark orange on the right side of the table. And while opponents have turned the ball over far less with Jokic playing, they haven't consistently shot a ton better from the field. Put it all together and it's been a net positive for the Nuggets.
The Gritty Details
Off court stats are included only for games in which the player was on the roster. That means if a player is traded mid-season, the rest of the season's stats for that team are not included in his off-court stats. As with on court stats, players with under 100 minutes are not included in the percentile calculations.
On Courtclick to show/hide
These stats tells us specifically how the team performed when a player was on the court. To give us context for how good any of these stats are, the percentiles compare this number to all other players. So let's say a player's team scored 109.0 points per 100 possessions when they were on the court, which ranked on the 75th percentile. That means that 75% of players' teams scored less than 109.0 points per 100 possessions when those players were on the floor.
Example: Nikola Jokic
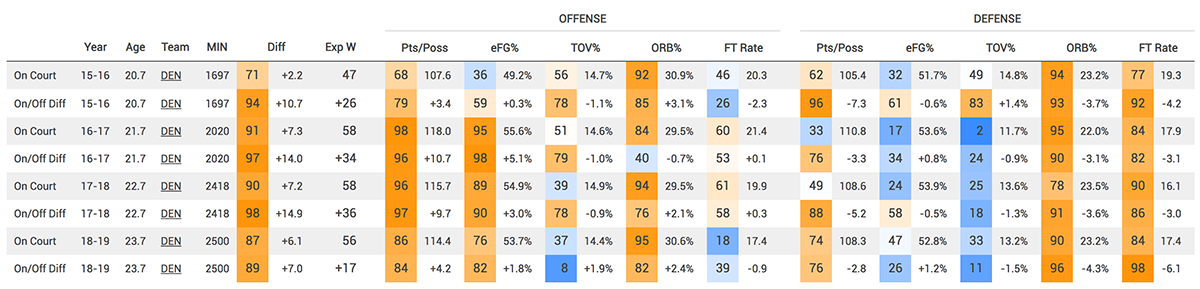
In 2018-19, the Nuggets had an efficiency differential of +6.1 with Jokic on the court. As we can see from the On/Off Diff line, that was 7.0 points per 100 possessions better than when Jokic was on the bench. That means the Nuggets played like a below .500 team with him off the court. In fact, we can see this in the Exp W column. That +6.1 mark equates to a 56 win team, which is 17 wins better than how the Nuggets played without Jokic. So with Jokic on the bench they played like a 39 win team, but with him in the game they played like a team that would finish at the top of the West.
And that's the least extreme difference of Jokic's career. You can see that in 2017-18, the Nuggets played like a 58 win team with Jokic in the game, but that was 36 wins better than without him!
The Gritty Details
Players with under 100 minutes are not included in the percentile calculations.