League: Play Context
The Play Context table takes you to an even deeper level of team analysis than the Four Factors Summary and Shooting tables by estimating the context in which various events happened.
Everything that happens in the game of basketball can be divided into four main contexts:
(1) Halfcourt. Anything that occurs when all 10 players are in the scoring half of the court and set in a normal guarding position. The majority of the game falls into this category.
(2) Transition. Anything that occurs as the teams are switching sides of the court and all 5 defenders are not back and set in a normal guarding position.
(3) Putback. Anything that occurs after an offensive rebound before the defense gets reset. An offensive rebound that is pulled out, allowing the defense to recover, just creates another halfcourt play.
(4) Miscellaneous. Anything else that doesn't fall into these categories, e.g. an intentional foul in the backcourt.
This page shows key team stats divided into the first three contexts. These contexts are estimated from play-by-play, so they are just estimates — but a lot of work has gone into trying to make them as accurate as is possible given the data. They should allow us to get the right, general picture, especially over larger samples.
Plays vs. Possessionsclick to show/hide
CTG distinguishes between possessions and plays, and this distinction is important when diving into context information. A possession starts when a team gets the ball and ends when they lose it. A play ends when the team attempts a shot, goes to the foul line, or turns the ball over. If a team gets an offensive rebound, that results in a continuation of a possession but a new play. So a possession can have multiple plays.
Play contexts are per-play, not per-possession. For example, a team might come down in transition and miss a shot, get the offensive rebound, kick it out, and run a halfcourt set. Then might miss that shot but get a tip in to score and end the possession. That was all one possession, but three different plays and three different contexts: the first shot was in transition, the second in the halfcourt, and the third was a putback. So the context stats shown in this table are per play.
Halfcourtclick to show/hide
There are three halfcourt stats shown: Pts/Play, OREB%, and % of Plays.
Pts/Play is fairly straightforward: it simply measures points scored per 100 halfcourt plays (so it's easier to read). This tells us how efficient a team was in a purely halfcourt context.
Note, though, that teams can get more halfcourt plays per possession than other teams by offensive rebounding. That's where OREB% comes in. This stat shows a team's offensive rebounding percentage from halfcourt misses. (Read more about the OREB% stat in the League Four Factors guide.)
The halfcourt is the least efficient of the contexts. This makes sense, since it is the context where the defense is set and in the best guarding position. That means that one goal of teams on offense is to play in the halfcourt as little as possible, and one goal of teams on defense is to keep their opponents in the halfcourt as much as possible. % of Plays shows us how well teams are accomplishing this. It tells us what percent of a team's plays were in the halfcourt.
Example: 2018-19 Top 10 Offensive Teams

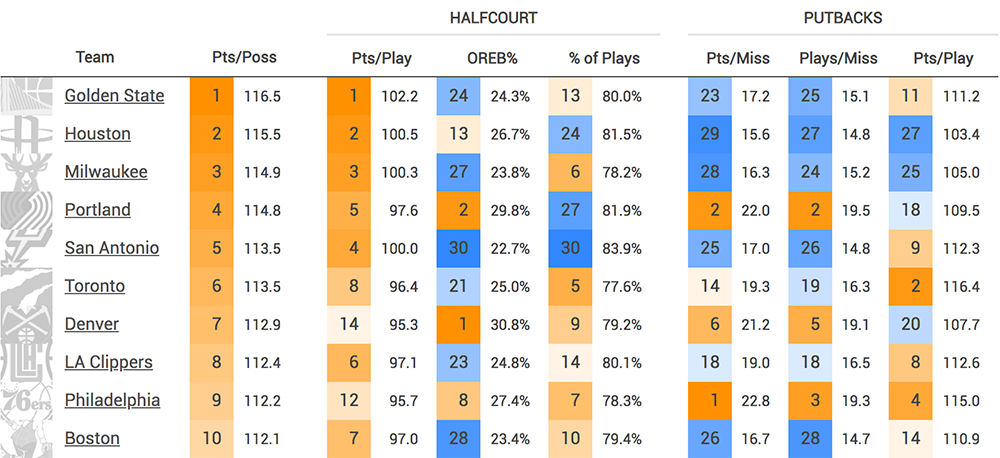
Since teams play in the halfcourt so much, a team's pts/play in the halfcourt is highly connected to their overall efficiency. We can see that of the top 10 offensive teams in overall points per possession, only Denver and Philadelphia (#7 and #9 overall) ranked outside the top 10 in halfcourt pts/play. Denver was fantastic on the offensive glass (#1 in halfcourt OREB%) and Philadelphia, as we'll see, was very efficient scoring in putback situations.
Transitionclick to show/hide
There are three transition stats shown: Pts+/Poss, Freq, and Eff. These three stats are shown for three different situations: (1) total transition, (2) transition that comes from steals, and (3) transition that comes from live ball defensive rebounds.
Points added per possessions (Pts+/Poss) is a little complicated, but after a lot of thought it seems to be the the best way to measure a team's overall transition effectiveness. To understand why, though, we have to examine the next two stats first: transition frequency and transition efficiency.
If you want to know how often a team is running, transition frequency is your ticket. It simply looks at what percentage of a team's possessions began with a transition event. If you want to know how effective a team is in transition, that's what transition efficiency is for. It tells you: for every possession that started with a transition event, how many transition points did the team score?
So if you want to find out how good a team is in transition, what do you look at? It's not just how often they run, because how efficiently they score in transition matters too. But it's not just about how efficient they are, because it matters a lot how often they run. CTG combines these two by estimating: how many points per 100 possessions is this team adding through their transition play? The details on how this is calculated are below, but the main takeaway is that Pts+/Poss is a way to get a one number measure of a team's transition play.
One last note: the frequency stats for transition off of steals and transition off of rebounds are a little different. For the STL Freq stat, it's showing: what percentage of a team's steals did they turn into transition? And for the Reb Freq stat, it's showing: what percentage of a team's live ball defensive rebounds did they turn into transition? This lets you know how often a team was able to run out of either of these situations (independent of how many steals or rebounds they got).
Example: 2018-19 Top 10 Offensive Teams

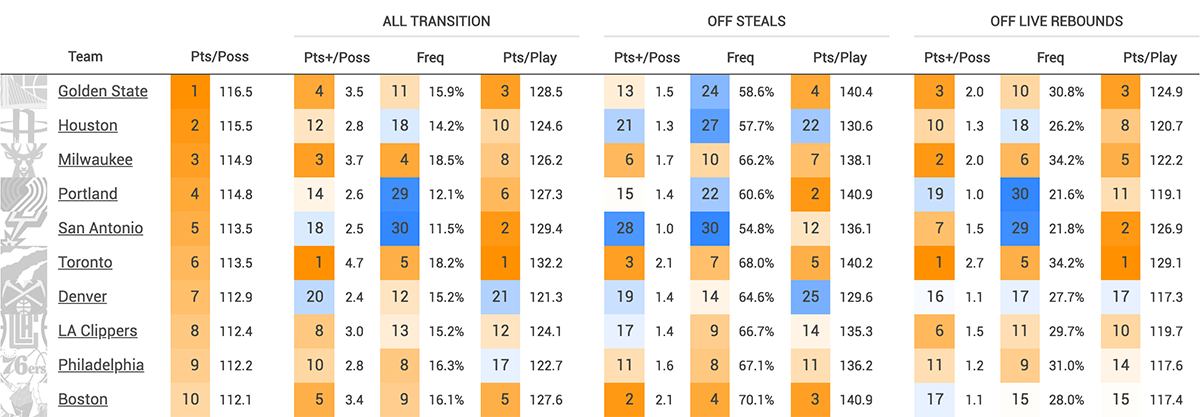
The Raptors were by far the league's best transition team. They were ran a lot, ranking 5th in transition frequency, and they were #1 in transition efficiency. They ran well off of steals (3rd in STL Pts+) and were incredibly efficient running off of rebounds (#1 in Reb Pts+).
Portland and San Antonio, meanwhile, both were efficient on offense overall despite running very rarely (29th and 30th in transition frequency). That's because they were efficient in transition when they did run, and because their half court offenses were so good.
The Gritty Details
A lot of gritty details on this one.
First note that CTG defines transition as starting at the beginning of a possession and only ending once the defense is set. That means that if a team comes down in transition and misses a shot but gets a putback, that putback is classified as part of the overall transition event and counted in those points. (If you were watching a game and saw that sequence happen, it would seem pretty clear that it's still part of transition.)
The details on how Pts+/Poss is calculated get complicated. It boils down to this: CTG takes a team's points per possession that starts with transition, and subtracts out what an average team does in a possession that did not start with transition. This tells us, per 100 transition possessions, how much more the team is scoring because they ran than if they played in the halfcourt. (We need to use an average team's halfcourt efficiency or a team that's good in the halfcourt on offense would bias these numbers and make them hard to compare across teams.) We take the result and multiply it by the team's transition frequency. This tells us how many points per 100 total possessions the team is adding through its transition play.
Putbacksclick to show/hide
Putbacks are plays that occur immediately after an offensive rebound before the defense gets set. This includes tip-in attempts, situations when the player came down with the rebound and went back up with it, or times when the rebounder passed it and the play ended (i.e. resulted in a shot, foul, or turnover) within a few seconds of the rebound. We have three stats for evaluating putbacks: Pts/Miss, Plays/Miss, and Pts/Play.
Pts/Miss shows how many putback points were scored per 100 reboundable misses in the halfcourt. It basically is combining (1) how often a team gets an offensive rebound (2) how often they turn that rebound into a putback play and (3) how efficient they are at converting their putback plays into points.
Plays/Miss is just a combination of the first two: how often a team gets a rebound and how often they turn it into a putback play.
Pts/Play, meanwhile, tells us how efficient a team was at converting their putback plays into points.
Example: 2018-19 Top 10 Offensive Teams

Most of the best offensive teams were not great scoring on the offensive glass. You can see that of the top 5 offensive teams, 4 of them ranked near the bottom of the league in putback points per miss.
Portland, Denver, and Philadelphia all jump out as getting a lot of points off of putbacks. Portland and Denver did a great job on the glass and were average at converting those attempts into points, but Philadelphia was very efficient in putback situations and that clearly helped boost a the 12th ranked halfcourt offense.
The Gritty Details
As mentioned in the transition section, putbacks that came out of transition are classified as transition events, not putbacks. So putback plays come from misses in either (1) the halfcourt or (2) other putback plays.

