
Player: Offensive Overview
The "Offensive Overview" table gives you a look at a player's overall offensive style by showing five stats: Usage, PSA, AST%, AST:Usg, TOV%. Let's look at each of these in order.
Usageclick to show/hide
A player's usage rate attempts to measure how much of a team's offense the player is responsible for. This isn't necessarily a good or bad thing — that depends on whether the player is using that offense efficiently (more on that in a second). But it does give you a sense of how much offensive responsibility the player is shouldering. A player with a very low usage is not creating much on offense (they are more of a role player), while a player with a very high usage is an offensive focal point.
Example: Giannis Antetokounmpo
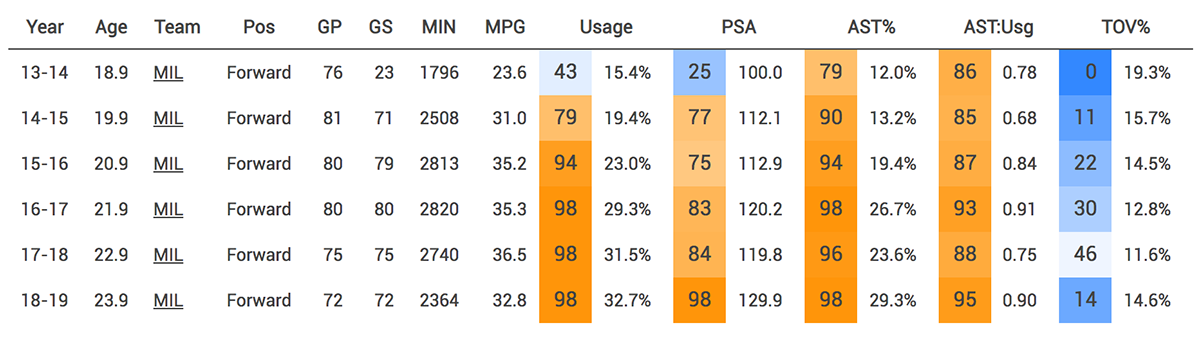
In the table above, we can see that Giannis had a below-average usage rate as a 19 year old rookie. His second year that number jumped to the 79th percentile, before ascending to near the top of the league, and continuing to climb each year after that.
The Gritty Details
CTG calculates usage rate by summing a player's field goal attempts, turnovers, and trips to the free throw line (not counting and-one opportunities), and dividing that by the team's total field goal attempts, turnovers, and free throw trips when the player is on the court. For the purpose of this stat, CTG also splits credit for assists between the passer and the shooter: assisted made field goals only count for half of a normal made field goal, and assists are also credited as half of shot used. One way to think about it: of all the shots and turnovers that happen when the player is on the court, what percentage of them were created by that player?
PSAclick to show/hide
A player's points per shot attempt shows just that: how many points this player scored per attempted shot (with a 2 or 3 shot trip to the foul line also counting as 1 shot attempt). The higher this number, the more efficient the player was when shooting. (This number is displayed per 100 shot attempts so it's easier to read.)
Note that this number is, generally, tied to usage rate, and should be interpreted alongside it. While it's not always true, for most players as their usage increases their efficiency will decrease. It's just difficult to create efficient shots — that's why the best offensive players in the NBA are those that can create these efficient shots even with a high usage. Role players, who have low usage, should find it easier to have a high PSA. They are more selective with their shot attempts and have them created by others more often, so it's easier for them to score efficiently.
Example: Giannis Antetokounmpo
Giannis struggled to score efficiently in his rookie season, with a PSA on just the 25th percentile for forwards. He figured out how to score efficiently in his second season, putting up a PSA of 112.1. In his MVP season, 2018-19, Giannis benefited from a new offense and more three point shooting around him to put up the most efficient scoring season of his career, scoring close to 1.3 points per shot attempt.
The Gritty Details
PSA is simply calculated by taking points the player scored (taking out technical free throws) and dividing it by field goal attempts and trips to the foul line (ignoring and-ones). Note that this is essentially the same as the True Shooting Percentage (TS%) stat you may have seen elsewhere. PSA is just TS% times 2. (TS% is divided by 2 to make it look more like a percentage, but CTG uses PSA because PSA is more understandable.)
AST%click to show/hide
A player's assist percentage shows how often the player is assisting teammates. Since a player can only get an assist when his teammate makes a field goal, AST% looks at how many of these teammate made field goals were a result of that player's assists. We can't just interpret this number by itself, since players will, of course, get more assists the more they have the ball. (The next stat, assist to usage ratio, attempts to account for this).
Example: Giannis Antetokounmpo
Giannis has always had a high assist rate for his position—his passing ability is a large part of what makes him so good. In his second year his assist rate ranked on the 90th percentile for forwards, and it hasn't dipped below that since.
The Gritty Details
CTG calculates AST% by taking a player's assists and dividing it by the number of his teammates' made field goals when he was on the floor.
AST:Usgclick to show/hide
A player's assist-to-usage ratio estimates how pass-first a player is by looking at their AST% and comparing it to their Usage. This fixes the problem noted in the AST% section, that players with higher usage rates will have higher assist percentages just by having the ball more. So Ast:Usg does a better job capturing how good of a passer a player is.
Example: Giannis Antetokounmpo
Part of Giannis' increase in AST% is simply that he had the ball more. His assist-to-usage ratio, though, shows that he's maintained a high rate of assists relative to how much he's had the ball through his whole career. In 2018-19, Giannis put up the highest assist rate of his career in part because he put up the highest usage rate of his career. His assist-to-usage ratio, though, shows that he also had a very impressive rate of assists given how much he had the ball.
The Gritty Details
CTG calculates AST:Usg pretty simply: dividing the AST% you see in the table above by the Usage rate.
TOV%click to show/hide
A player's turnover percentage tells us what percentage of a player's used possessions (as defined in the "Usage" section above) ended up as turnovers. This roughly tells us how turnover prone a player is, taking into account how much they're doing on offense.
Example: Giannis Antetokounmpo
One of Giannis' biggest weaknesses is his turnover rate: he has never taken care of the ball at an above averate rate for forwards. That said, he had improved his turnover rate in every year of his career until taking a step back in the 2018-19 season. With his aggressive style and high passing rates comes risk.
The Gritty Details
CTG calculates turnover percentage by dividing a player's turnovers by their used possessions. As written in the Usage section above, used possessions is calculated by summing a player's field goal attempts, turnovers, and trips to the free throw line (not counting and-one opportunities). For the purpose of this stat, CTG also splits credit for assists between the passer and the shooter: assisted made field goals only count for half of a normal made field goal, and assists are also credited as half of shot used.